
The coronavirus pandemic is already delivering eye-popping economic data, with the U.S. unemployment rate reaching 15% in April, the worst number since the Great Depression. Despite the inflow of very bad data, equity markets have rallied over the past six weeks, leaving many investors wondering if the market is exhibiting irrational exuberance.
A recession is certainly underway in the U.S. and global economies. Our updated forecast is that U.S. GDP will fall 3.9% and global GDP will fall 2.4% in 2020 (down 100 basis points from our last GDP forecast). But the most important question for investors isn’t what happens in 2020; it’s what happens in the recovery afterward. The economic impact of COVID-19 and the recession on long-run GDP is key to understanding whether the recent rebound in equity prices makes sense.
We have examined the history of global recessions for clues on the COVID-19 recession’s impact on long-run economic growth. Our analysis shows that many recessions don’t have a long-run economic impact. The worst recessions in terms of long-run economic impact (the Great Depression or the Great Recession) are generally the product of persistent economic policy error. We’ve distilled our learnings on what causes recessions to go wrong into a long-run impact scorecard, on which we rate the COVID-19 recession. Most important, policy response has been extremely impressive, especially the United States’ historically large fiscal stimulus. Likewise, we think risks of a financial crisis are small currently as central bankers are unconstrained by the moral hazard quandary. Underlying structural issues going into this recession pale compared with the economic distortions before the Great Recession. We forecast a long-run impact on U.S. and global GDP of just negative 1%.
What Will the Recovery Look Like?
Amid surging unemployment and other economic data that seems to set new records by the day, investors are debating how bad the U.S. and global economies will get in 2020. But few are talking enough about the most important question for investors: What will the long-run recovery look like?
The traditional textbook economic model says that the level of GDP is well characterized by a combination of a short-run cycle and a constant, long-run trend. Recessions are discussed purely in connection with the former and aren’t held as relevant for long-run growth.
Reality came crashing down on the textbook view with the 2008 Great Recession, when GDP remained sustainably depressed compared with the prerecession trend. This was particularly bad in the advanced economies. From 2008 to 2019 (inclusive of the recession), U.S. growth averaged just 1.7%, far below the 3.1% average from 1998 to 2007. This amounted to 15% lower real GDP by 2019 compared with the prerecession trend. The eurozone countries saw 1.1% growth from 2008 to 2019, far below their 1998-2007 average of 2.7%.
Last time around, many were slow to appreciate the long-run hit to GDP. The International Monetary Fund was forced to lower its global GDP forecasts several times in the early 2010s as the anticipated V-shaped recovery failed to play out (a V-shaped recovery is implied if GDP recovers to its long-run trend).
We think investors and others have learned the lesson of 2008’s lackluster recovery, but perhaps they’ve learned it all too well. Investors shouldn’t get too caught up in 2008 and take it as their base-case model of a recession.
Many recessions historically haven’t been like 2008 and instead have had a very robust recovery. In some cases, recessions appear to have zero negative impact on long-run GDP growth. There’s good reason to think that the COVID-19 recession won’t resemble recessions like 2008, which had a large long-run impact on GDP. As such, we forecast just a 1% impact on the long-run level of GDP for both the U.S. and the world.
Why Does Long-Run GDP Matter?
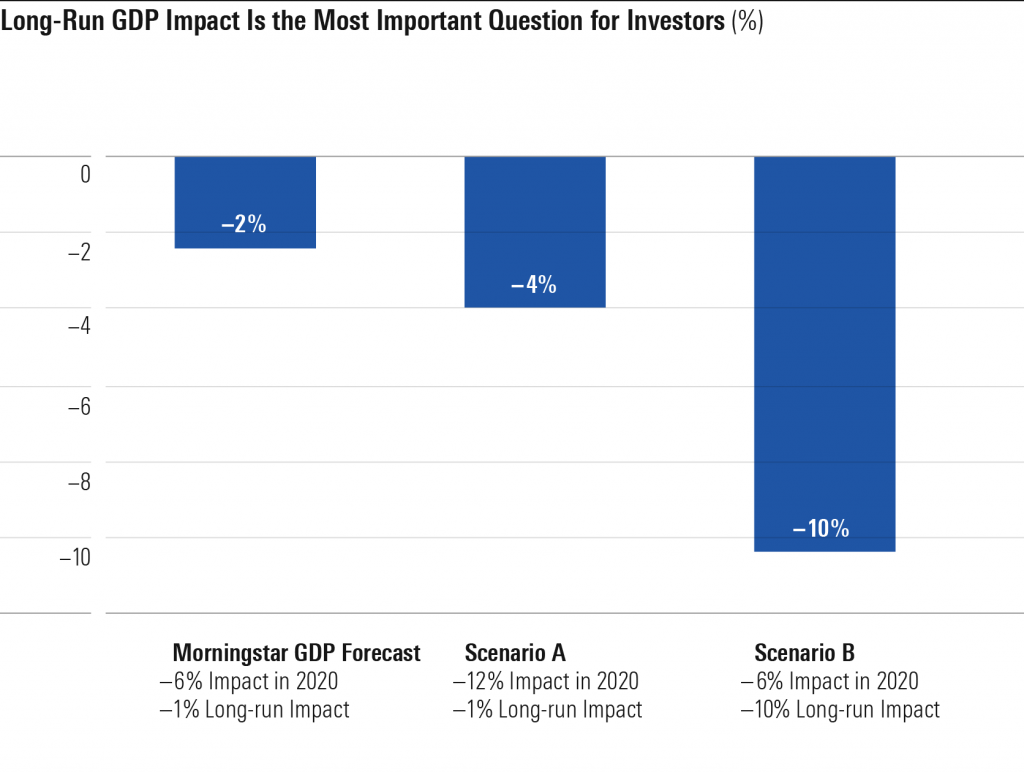
Given that we value stocks as the sum of discounted cash flows (and given our long-run investment philosophy), long-run GDP is far more important for our stock valuations than what happens in a single year.
In our sensitivity analysis for the fair value of a “typical” stock, we model that the impact on 2020 free cash flow (in percentage terms) is 2 times the impact on GDP growth, taking into account the procyclicality of corporate profits. We assume that the impact on long-run cash flows is equivalent to the impact on long-run GDP. We use a linear interpolation for cash flow impact for years between 2020 and the long run.
The analysis shows that fair values are far more sensitive to long-term GDP impact than the short-run hit. Using our current GDP forecast of a negative 6% impact on 2020 GDP but just a negative 1% long-run impact, we model a 2% hit to equity value. We compare our base case with a Scenario A, in which the 2020 impact is negative 12% but the long-run impact is negative 1% (as in our base case), as well as a Scenario B (akin to the Great Recession), in which the 2020 impact is equivalent to our base case but the long-run impact is much worse at negative 10%. Scenario A produces a negative 4% impact on equity value. Scenario B is far worse, with a 10% impact on equity value.
We can use this analysis to get a hint of what the S&P 500 was implying when it was at the trough of a 35% drawdown in late March 2020. If we assume that roughly half of the drawdown was an increased risk premium, then that implies a 17.5% hit to equity values via reduced cash flows. To get to that level, we’d need around a 15% hit to 2020 and long-run GDP. Even if we assume just one third of the drawdown (about 12%) was due to cash flow expectations, that would require a double-digit hit to long-run GDP to produce that level of impact on equity value.
Our Framework to Project COVID-19’s Long-Run Economic Impact
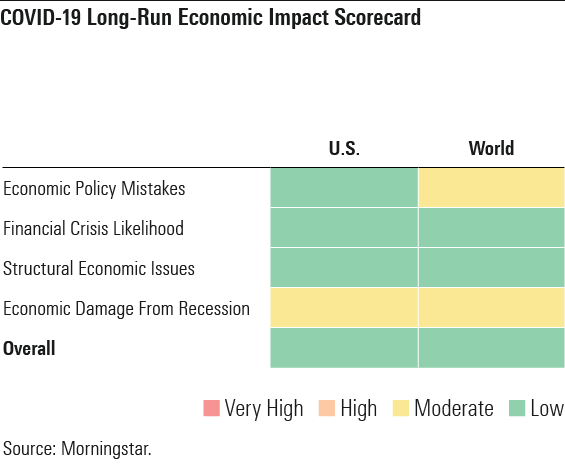
We rate the impact on the economy on four dimensions: economic policy mistakes, financial crisis likelihood, structural economic issues (pre-COVID-19), and economic damage caused by the recession.
Overall, we rate the U.S. and global economies as having low risk of long-run economic damage. This supports our GDP forecast for just a 1% impact on the long-run level of real GDP. This would put the COVID-19 recession toward the upper end of the range of historical recessions (in the top 18% in our historical analysis). To some degree, an extraordinarily strong economic policy response can make up for deficiencies in other dimensions. For example, if a fiscal stimulus on par with World War II had been deployed earlier in the Great Depression, it plausibly would have fully offset the fallout from the financial crisis as well as other structural economic weakness.
Fiscal Stimulus Has Been Very Impressive So Far
Our analysis of economic policy mistakes focuses on the role of monetary and fiscal policy, as our analysis shows that deficiencies in either is a key driver of severe, long-lasting recessions. For now, the world has passed the test overall, and the U.S. has been resoundingly successful.
The U.S. has responded to surging economic pressures from COVID-19 with fiscal stimulus of herculean strength. On March 27, President Donald Trump signed an over $2 trillion stimulus bill (about 10% of U.S. 2019 GDP). Based on the U.S. Congressional Budget Office analysis, the stimulus will add about $1.6 trillion to the U.S. budget deficit (8% of GDP) in 2020.
We feel comfortable penciling in at least a 1,000-basis-point impact on the deficit from federal stimulus in 2020 overall. Congress already passed another $500 billion bill on April 23 (largely to extend the Paycheck Protection Program providing forgivable loans to small businesses), which hasn’t been incorporated into the CBO’s estimates above. We think there’s a fair chance Congress will approve more stimulus in 2020 and beyond as needed to support the economy. This is because the March 27 stimulus bill signifies a colossal political shift, in our view–a development that has been glossed over in the news coverage.
In the Great Recession aftermath of the 2010s, the primary obstacle to incremental fiscal stimulus was staunch Republican congressional opposition, ostensibly due to ideological commitments to less government invention in the economy. Now, the Trump-led GOP has emerged as a champion of fiscal stimulus. Given this and a Democratic Party that retains its economic interventionist leanings, we see little reason why the U.S. won’t do whatever it takes to prop up aggregate demand.
Combining our estimate of 1,000 basis points of direct stimulus with about 200 basis points of contribution from automatic stabilizers (for example, reduction in taxation as income falls due to progressive tax rates), we forecast a 2020 U.S. federal deficit/GDP ratio of 17%, up 1,200 basis points from 2019. This fiscal intervention dwarfs anything seen in the U.S. since WWII. It’s far greater than the post-Great Recession fiscal stimulus as well as the New Deal-era budget deficits.
Policy support elsewhere in the world has not yet been as aggressive as in the U.S. In particular, we’ve been concerned that the eurozone’s fiscal support will resemble its poor record after the Great Recession, when austerity dragged severely on eurozone economies. On the other hand, in mid-April, European leaders agreed to a joint roughly $600 billion in fiscal stimulus, or roughly 4% of GDP. So, it does look like they’re moving in the right direction.
Overall, the zero lower bound on interest rates is less of a constraint for emerging-market economies, allowing them to rely much more on conventional monetary policy to offset economic weakness.
Aggressive Fed Support Is Containing Financial Crisis Risks
We think the risk of a financial crisis is small for now. The simplest argument is that because the recession wasn’t caused by a financial crisis, underlying risks probably aren’t on par with 2008. In our recent study of credit risks for U.S. banks, we argued that nothing the banks are doing resembles the subprime market of 2007. We updated our view on U.S. banks in April, noting that while we’re somewhat wary given the unprecedented speed of the COVID-19 economic shock, overall we remain confident in the banks. U.S. banks’ capital ratios are much stronger than before 2008. Given the interlinkages of the global financial system, establishing the health of the U.S. financial system goes a long way toward proving the condition of the world as whole.
Crucially, we think the Federal Reserve has acted impressively quickly so far. Beyond the 50-basis-point cut of interest rates to effectively zero on March 15, the Fed has deployed an array of heavy weaponry not seen since the global financial crisis, including facilities to support liquidity in the commercial paper and money markets. Given the zero lower bound on interest rates, the Fed’s ability to support the broader economy is somewhat limited. However, it has a very large role in preventing a financial crisis. Unlike 2008, we think the Fed is acting without inhibition regarding moral hazard (the concern that bailouts encourage bad behavior and thereby weaken the long-run economy). No firm or individual is responsible for the economic distress caused by COVID-19, so moral hazard concerns are minimal.
However, we’ll be watching financial crisis risks closely in coming months. Financial crises have strong “self-fulfilling prophecy” dynamics, whereby negative sentiment has the possibility of creating a crisis almost irrespective of the fundamentals. As such, rapid updating of views to current conditions is crucial in forecasting this variable.
Policymakers do have some leeway in how quickly they respond to rising risks. The collapse of banks in the Great Depression didn’t start until late 1930, one year after the stock market crash. Likewise, Lehman Brothers collapsed in September 2008, well after the economy had begun weakening and risks had become apparent.
Structural Economic Issues Are Minimal, in Our View
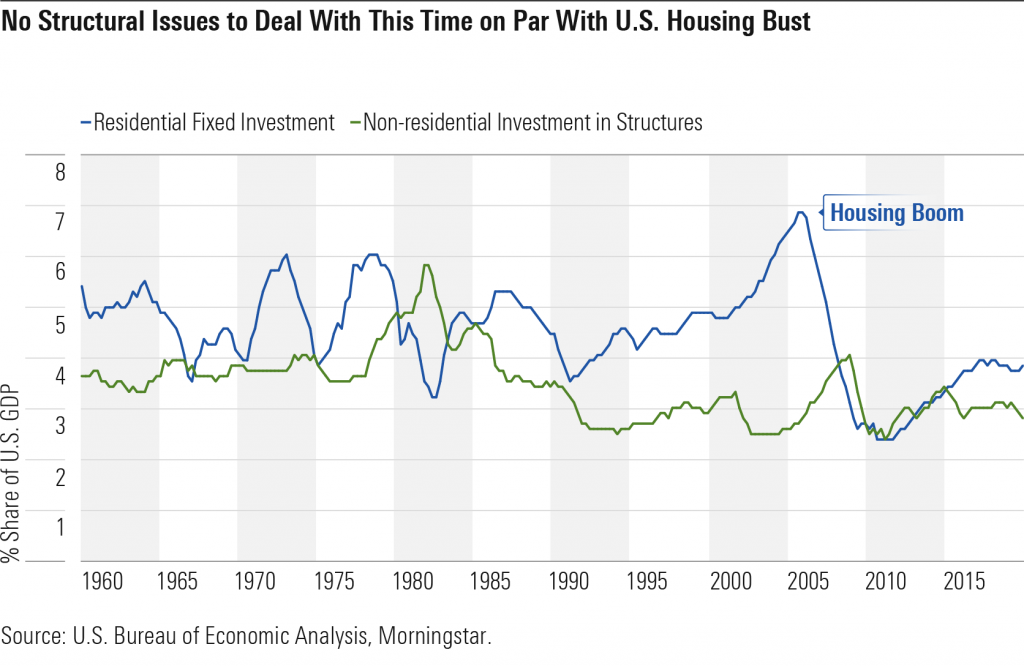
We think structural economic issues (in place before COVID-19 struck the economy) are largely a nonconcern this time around. This is not to say that economic growth was great pre-COVID-19; it wasn’t. Rather, the economic growth that we had was highly sustainable for the world overall. There was nothing doomed to fail in following that trajectory of growth. Global inflation was minimal (indicating no overheating of the economy), and we see no large sectoral imbalances on par with the housing boom before the Great Recession.
Economic Damage From the Recession
Right now, economic damage is probably the greatest area of uncertainty. Given the speed at which the economy is deteriorating in the short run (with the unemployment rate hitting 14.7% in April, the worst since the Great Depression), predicting knock-on effects that could have a long-lasting impact is inherently difficult. The balance sheets of consumers and firms are being damaged by the shortfall in income, and this could have a lingering effect on real economic activity in coming years even after the pandemic subsides. Insofar as these issues amount to a weakness in aggregate demand, they can be offset by sufficiently aggressive monetary and fiscal policy. However, if these issues destroy the economy’s productive capacity, then demand-side policies may have limited efficacy. We think these issues are likely to be severe mainly if the recession is very long-lasting. For example, one risk is that unemployed workers gradually lose human capital; a short spell of unemployment isn’t likely to be as damaging as long-lasting exclusion from the workforce.
Updating Our Near-Term GDP Forecasts
We now expect a 3.9% fall in U.S. GDP in 2020 and a 2.4% fall in global GDP in 2020, incorporating a 600-basis-point and 550-basis-point negative impact, respectively, from COVID-19. These GDP forecasts are down about 100 basis points from our prior report, which goes into our short-term GDP forecast methodology in more detail. Our short-term analysis in that report still holds overall, but we’re adopting a more conservative near-term outlook for now. In particular, we’re more worried that emerging markets will see a larger hit to near-term economic activity than we previously anticipated. For the U.S., we’re slightly less optimistic than we were before on the impact of new drug treatments in the second half of 2020. We’re also concerned about a larger-than-anticipated GDP impact in sectors we thought would be more resilient (such as healthcare). On the other hand, we’ve notched our 2020 China GDP forecast up to negative 2.1% from negative 2.4% previously, as its economic recovery has been slightly faster than anticipated. This augurs somewhat positively for the rest of the world if other countries follow China’s experience at a lag.
Our global growth forecast is worse than the approximate 0% global GDP growth we saw at the 2009 nadir. However, the 2009 slowdown started from a higher base (5.6% real GDP growth in 2007), meaning the deceleration in growth rates was roughly on par with we expect for COVID-19 in 2020.
In our latest forecast for the epidemic itself, our new base-case scenario assumes that less than 10% of the U.S. population is infected by the end of 2020, with a 0.7% death rate, as improving levels of testing help control the spread of the disease. Better diagnostics and treatments will allow social distancing to be relaxed somewhat through the second half of 2020, and we expect the broad availability of a vaccine by mid-2021 to allow for a return to normality.
How Will COVID-19 Affect the Economy?
First, we should ask whether COVID-19 embodies a supply-side or demand-side shock to the economy. In the short run, it’s both, and perhaps the demand-side impact is slightly greater, given that inflation has slowed so far. Below we list key factors as they apply to the short run.
Key Supply-Side Factors
- “Nonessential” businesses are being closed (often mandatorily, but sometimes voluntarily) for social distancing purposes.
- Labor supply is being curtailed because of sick workers. Also, many workers are working from home, which may be suboptimal for some.
Key Demand-Side Factors
- “Confidence” is the key demand side channel. Confidence is an elusive concept to quantify or model in a precise way, but it is a major demand-side driver of economic activity.
- Falling consumer confidence is weighing on lower household consumption.
- Falling business confidence is probably slowing investment.
- Laid-off or temporarily furloughed workers in affected sectors are likely reducing their short-term consumption, though this is being mitigated by fiscal stimulus and other government programs.
While all of the above factors are serious potential drivers of short-run GDP impact, most of them should abate once the pandemic is over, and therefore they aren’t logical contributors to long-term GDP impact.
On the supply side, for example, closed businesses can reopen as the outbreak subsides. Laid-off or furloughed workers will be able to return to work. On the demand side, confidence should return quickly, and consumers and businesses will be eager to make up for postponed expenditures.
With regard to the supply side, capital shouldn’t be affected in the long run by COVID-19. Investment spending will be reduced in 2020, but capital stock growth can catch up to its long-run trend via extra investment after 2020. The long-run capital stock is driven by structural parameters like the marginal productivity of capital and people’s appetite for savings.
Labor supply should be minimally affected in the long run. A COVID-19 recession doesn’t fit the mold of past recessions that have had very slow labor market recoveries.
Finally, what about productivity? It’s plausible that some factors, such as reduced research and development, reduced “learning by doing” from lower overall activity, or reduced education could cause a permanent impact on total factor productivity. That said, U.S. and global TFP growth has been running at under 1% annually in recent years. Therefore, even losing a meaningful fraction of one year’s TFP growth means a fairly modest impact on long-run GDP growth.
Not All Recessions End Badly for Long-Run Growth
When we look at all post-WWII U.S. recessions, the Great Recession is an outlier in terms of the long-term trend in GDP growth. In fact, most recessions showed something approximating a full recovery in long-run growth.
We exclude the 1945 U.S. “recession,” which likely is a statistical illusion created by overmeasurement of output during WWII (when defense spending was over 40% of GDP). Unemployment remained at or below 4% from 1945 to 1948.
1960 illustrates the most benign recession, as GDP grew 5.1% in the five years starting with the recession, compared with 2.6% in the five years before the recession. The 1957 and 1981 recessions also had postrecession growth rates higher than prerecession growth.
Overall, excluding the Great Recession, the average post-WWII U.S. recession had average growth that was 50 basis points lower in the five years starting with the recession compared with the five years prerecession. That cumulates to a negative 2.5% total impact over a five-year period. Very likely, this is an overstatement of the average impact of recessions on growth, as U.S. growth experienced a secular slowdown over the past half century for reasons unrelated to recessions. U.S. growth averaged 4.1% in the 1950s and 1960s but then slowed to 3.3% over the 1970s through the 1990s. Growth then slowed to 2% over the 2000s and 2010s.
1981-82 Recession Example of Benign Long-Run Impact
The typical post-WWII U.S. recession (excluding the Great Recession) is well characterized by the following story: The economy begins overheating as output brushes up against capacity, leading to higher inflation. The Federal Reserve increases interest rates in order to tame inflation, which causes a temporary economic slowdown as collateral damage.
The 1981-82 recession is an archetypal example of this story. Paul Volcker, who became Fed chair in 1979, sought to rid the economy of the inflation of the 1970s. The Fed throttled back on money supply growth, causing an increase in the federal-funds rate (the benchmark for short-term U.S. interest rates) from 10% in the third quarter of 1980 to 18% by the second quarter of 1981. The Fed didn’t let off the brakes even as inflation slowed in 1981. As a result, the real fed-funds rate (subtracting inflation from the nominal fed-funds rate) remained at about 8% through the middle of 1982.
This monetary tightening accomplished the Fed’s goal of taming inflation, but it also caused a sharp short-run economic slowdown. GDP growth slowed to negative 2% for 1982, and unemployment increased to about 11% (actually higher than the Great Recession peak of about 10%).
However, once the Fed accomplished its goal of braking inflation and shifted to monetary easing, the economy came roaring back, even surged past its prerecession trajectory. Real GDP growth was 4.6% in 1983 and 7.2% in 1984.
What was it about the 1981-82 recession that caused the long-run impact to be so benign? Ultimately, we’d argue that it was the lack of underlying structural issues in the real economy. Instead, the recession was precipitated by high inflation, caused by a general overheating of the economy (and excessively high inflation expectations, which are self-reinforcing until deflated by monetary authorities). Overall, there was nothing unsustainable about the pattern of economic activity before the recession, which meant that once inflation was cured, the economy could quickly leap back to its prior condition. We think this is a good analogy for a COVID-19 recession, because there was nothing unsustainable about the economy itself before the epidemic. The 1981-82 recession didn’t see a severe financial crisis, and we don’t think we’ll see a severe financial crisis as a result of COVID-19.
Global Analysis Confirms Many Recessions Benign for Long-Run GDP
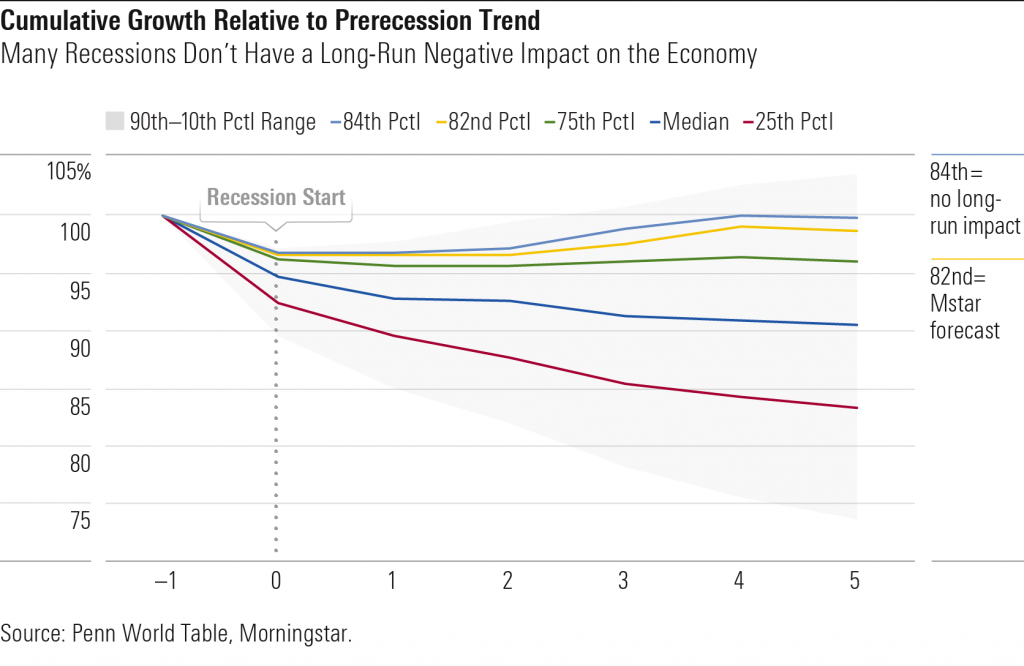
Looking globally, we examined 191 recessions occurring in a sample of 48 countries from 1950 to 2017. For each recession, we first calculate the prerecession real GDP (exponential) trend using the average growth rate for the five years before the recession start year. Then, we calculate the ratio of actual real GDP to the prerecession trend. Ranking all recessions by the ratio of actual GDP to prerecession trend at year 5, we plot the median recession as well as various other percentiles.
There is an extremely wide range in long-run outcomes across recessions, with year-5 GDP ranging from 4% above the long-run trend at the 90th percentile to 26% below the long-run trend at the 10th percentile. Most of this dispersion accumulates well after the recession start year.
Also, there are plenty of global recessions with a benign impact on long-run GDP. In fact, 16% of cases end up at or above the prerecession trend by year 5 after the recession. If we take our forecast of 1% as corresponding to a 0.99 ratio of year-5 output to the prerecession trend, then this lies as the 82nd percentile across our sample. In other words, 18% of recessions have ended up at least as positive as we project for a COVID-19 recession.
Digging deeper into the data, we’re somewhat worried by the positive relationship between short-run recession severity and long-run economic impact, as we expect a sharp fall in U.S. and global GDP in 2020 as a result of COVID-19. Recessions that start badly tend to end badly. However, we’re skeptical about the applicability of this relationship to a COVID-19 recession. Deep recessions are associated with weaker long-run GDP because they are typically triggered by large underlying structural issues with the economy. This includes all manner of banking, debt, and currency crises, among others. It’s the presence of these underlying structural issues that causes both the deep short-run recession and the long-lasting impact.
Furthermore, our analysis above is somewhat biased (against our argument) by downward secular trends in GDP growth over the sample period. Insofar as these trends are not caused by the recession, the postrecession shortfall in GDP should properly be decomposed into the negative impact from the recession and the negative impact from the secular trend. If we were to strip out the impact of the latter, it would bolster our argument that many recessions have little long-run negative impact on GDP.
Why is a secular downtrend in growth good news for our purposes? It means that the impact of recessions on long-run GDP is overstated by a cursory look at the historical data. While we don’t correct for secular trends in GDP in our analysis, Blanchard, Cerutti, and Summers do so in a 2015 paper. To gauge the impact of recessions on long-run GDP, they use a methodology quite similar to ours at a basic level, by measuring the degree to which postrecession GDP recovers to its medium-run precrisis trend. However, they also correct for long-run secular trends in growth, among other confounding factors. Compared with our finding that 16% of recessions yield no long-run impact on GDP, Blanchard, Cerutti, and Summers find that 31% of all recessions have no long-run impact on GDP.
Financial Crises Seem to Lead to Worse Long-Run GDP Impact
Another interesting finding from Blanchard, Cerutti, and Summers is that there’s a large difference in outcomes between recessions associated with financial crises and other recessions. Only 17% of financial crisis recessions see no long-run impact on GDP, compared with 34% of recessions without a financial crisis. Therefore, an economy that experiences a financial crisis is only half as likely to claw its way out of a recessionary hole than one without a financial crisis.
This accords with broader literature studying the impact of financial crises. Oulton and Sebastia-Barriel find that for each year an economy is in banking crisis, long-run labor productivity (real GDP per worker) is reduced by about 1% and long-run GDP per capita is reduced by about 2% (however, the authors find a negligible impact when considering financial crises excluding banking crises). Likewise, Furceri and Mourougane find that financial crises reduce potential output by 1.5%-2.4% on average. Exactly why financial crises have a long-lasting effect on the economy is a matter of debate, but both of the papers cited here find a large deleterious impact on capital accumulation. This is logical, as an impaired financial sector is likely to hamstring capital allocation across the economy.
Two Stories for How Recessions Are Associated With Lower Long-Run GDP
There are two main stories for how recessions would affect long-run GDP, neither of which portends disaster when applied to the case of COVID-19. The first story points to supply shocks, but COVID-19’s supply-side impact should be short-lived. The second story points to weak demand, but policymakers have the tools to fight COVID-19’s impact on demand (namely fiscal stimulus). We argue that irrespective of which of these stories is true, applying the conceptual model to the case of COVID-19 augurs positively about the long-run GDP impact.
Why Was the Great Depression So Bad?
The Great Depression was an economic catastrophe without parallel in the modern era. U.S. real GDP fell roughly 30% from 1929 to 1933, and other countries saw peak-to-trough declines generally in the range of 10%-20%. This fall in economic activity was prolonged; for example, U.S. unemployment averaged 18% over the whole of the 1930s.
While the initial drop in output in 1930 was probably due principally to a collapse in confidence in wake of the October 1929 stock market crash, the extended slide in the global economy through 1933 was driven by two main factors: First, a financial crisis began with a banking panic in late 1930 in the U.S. and extended to much of the rest of the world in 1931. Second, the U.S. and other countries were subjected to arguably the worst economic policy in history, as central banks’ misguided commitment to the gold standard led them to engineer a severe contraction in the money supply.
Of the two factors, the policy mistakes were probably more decisive. The financial crisis was likely a necessary but not sufficient condition for the economic carnage of the Great Depression, as a much different monetary policy probably could have contained the damage from the crisis. GDP for major economies rebounded sharply after they exited the gold standard.
Still, even economic doomsday doesn’t rule out a full recovery. Once policy errors were corrected, the U.S. and global economies mounted a robust recovery. Given a strong enough policy response (the fiscal boost of WWII), U.S. GDP even fully recovered to its pre-Great Depression trend. This suggests that we can cure the economy of long-run effects from even the worst economic downturn in history.
Why Was the Great Recession So Long-Lasting?
The distinctive characteristic of the Great Recession was not the initial downturn but rather its seemingly long-lasting impact on GDP. This was particularly bad in the advanced economies. From 2008 to 2019 (inclusive of the recession), U.S. growth averaged just 1.7%, far below the 3.1% average from 1998 to 2007. This amounted to 15% lower real GDP by 2019 compared with the prerecession trend. The eurozone countries saw 1.1% growth from 2008 to 2019, far below their 1998-2007 average of 2.7%.
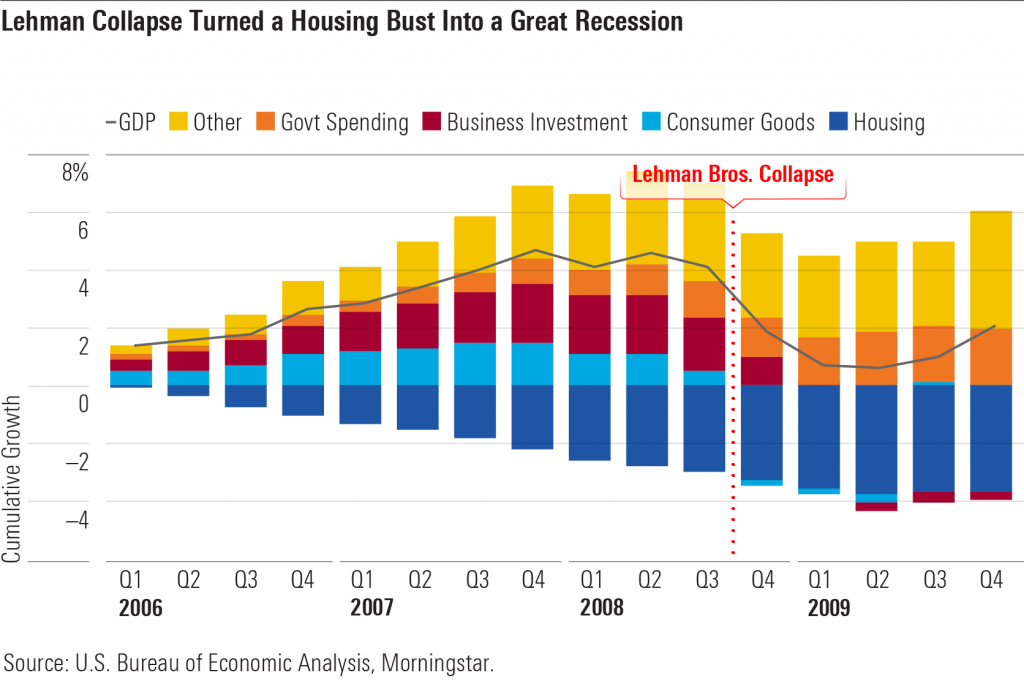
The worst of the Great Recession came after Sept. 15, 2008, when Lehman Brothers filed for bankruptcy. Until then, real GDP growth had been slowing, with third-quarter 2008 GDP about flat with third-quarter 2007 levels. However, the bottom fell out after Lehman, with GDP falling a cumulative 3.3% (6.6% annualized) in the fourth quarter of 2008 and first quarter of 2009. Global GDP followed a similar pattern.
After Lehman collapsed, stress in the financial system skyrocketed. Lehman was closely tied to many parts of the financial system. For example, the potential for a liquidation of its large commercial mortgage-backed securities caused a sell-off in CMBS markets. Many worried about money market funds that held Lehman-issued commercial paper. The $60 billion Reserve Primary Fund was forced to liquidate for this reason. In general, trust collapsed as market participants wondered who was next.
Though the U.S. government responded by enacting the $700 billion Troubled Asset Relief Program on Oct. 3, 2008, to inject capital into the banking system, this was too late to prevent a cascade of negative financial market events and plunging confidence. The Office of Financial Research’s Financial Stress Index quadrupled by the end of the year from pre-Lehman levels. The FSI was driven higher by increases in market volatility, credit spreads, and bank funding rates. Not only were these financial stress measures a signal of dimming financial market expectations for the real economy, but also they directly caused weakening of the real economy. Rising credit spreads pushed nonfinancial corporations into financial distress or bankruptcy and generally inhibited business activity. Banks’ inability to obtain short-term funding caused a contraction in bank lending overall.
Before Lehman, GDP growth had already been slowing gradually due especially to housing. Consumer goods growth was slowing, likely driven by slowing employment in construction, real estate, and related industries along with diminished household wealth due to weakening housing prices. However, it was the Lehman collapse that largely turned a housing bust into the Great Recession. In the fourth quarter of 2008, the rest of the economy outside of housing collapsed. Business investment was especially hard hit.
Why did the Federal Reserve allow Lehman to go bankrupt, and what lessons does this have for a COVID-19 recession? To some degree, the Fed simply underrated the overall fragility of the financial system, which made the failure of a single bank a potential cause for a systemwide collapse. However, at the time, the official story was that the Fed deliberately let Lehman fail due to “moral hazard,” the notion that bailouts reduce banks’ incentive to consider risk and therefore make the long-run financial system weaker. Although Fed Chair Ben Bernanke later said saving Lehman was “impossible” due to its deep insolvency, this claim was vociferously disputed by other economists. Alan Blinder argues that the line between illiquidity and insolvency is very thin, and it makes little sense for the Fed to have bailed out Bear Stearns in March 2008 and then let Lehman fail. In our view, fear of moral hazard explains the Fed failing to pull out all the stops in 2008.
Where does this leave us for a COVID-19 recession? Arguably, moral hazard is a nonissue this time around. No economic actor can be reasonably blamed for the financial distress encountered as a result of COVID-19’s impact on the economy. As such (in contrast to a usual financial crisis, which has some genesis in excess risk-taking by financial actors), there should be essentially zero concern with moral hazard right now. We think the Fed’s very aggressive actions so far reflect this, and we expect the Fed to do whatever is necessary to keep key financial system participants liquid during this crisis.
Structural Economic Issues Weighed for Years After Great Recession
The hangover from the housing boom along with fallout from the financial crisis weighed on the U.S. economy for years after the Great Recession. U.S. residential investment as a share of GDP soared during the boom, but the overstock of housing and effects of the financial crisis caused it to reach historic lows during the bust.
Employment in the boom sectors (construction, real estate, and banking) remained depressed for years after the crisis. The slow recovery in the unemployment rate and labor force participation almost certainly reflected the fact that workers in these boom industries couldn’t easily find work elsewhere. The decline in construction in conjunction with the fall in manufacturing employment was particularly problematic.
In addition to these sectoral shocks, the fallout from the financial crisis depressed aggregate demand broadly for the U.S. and Europe. Both economies were afflicted by a slowdown in household credit, though the U.S. was hit particularly hard. In the eurozone, the precrisis flow of capital from savers (namely Germany) to debtors (Spain, Portugal, Greece, and Italy) was choked off, as reflected in these latter countries’ current accounts swinging from deeply negative to positive levels.